Observability in Distributed Systems
Making sense of your microservices
Introduction
Over the last several years, enterprises have rapidly adopted cloud-native infrastructure services, such as AWS, in the form of microservice, serverless and container technologies. These modern cloud environments are dynamic and constantly changing in scale and complexity, and most problems are neither known nor monitored in such a vast distributed network.
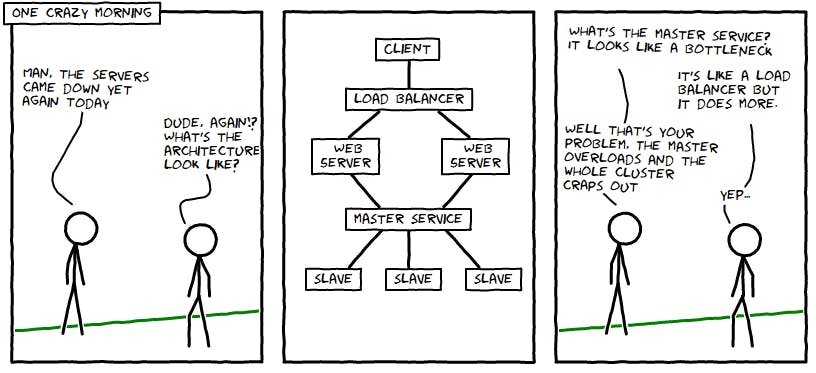
Imagine working at the scale of Netflix or Amazon, with thousands of microservices distributed throughout hundreds of datacenters across the world. Assume a situation where customers of Amazon are unable to check out the items in their cart, and hence not able to place any orders. The revenue loss caused by this issue could be huge if it's not fixed withing a few minutes. But how would the support or engineering team at Amazon get to know about the issue in the first place? Waiting for customers to call and complain would be too late and too expensive.
“A distributed system is one in which the failure of a computer you didn’t even know existed can render your own computer unusable.” - Leslie Lamport
In modern cloud native systems, the hardest thing about debugging is no longer understanding how the code runs, but finding where in your system the code with the problem even lives. In a distributed environment, understanding a current problem is an enormous challenge, largely because it produces more “unknown unknowns” than simpler systems. With so many moving parts, it is often challenging to find out the root cause of an issue and trace it back to its origin. This is where observability comes into the picture.
What is Observability
The term “observability” was coined by engineer Rudolf E. Kálmán in 1960. It has since grown to mean many things in different communities. In the current scenario, observability is best described as the ability to measure the internal states of a system by examining its outputs. A system is considered “observable” if the current state can be estimated by only using information from certain measurable outputs.
Observability enables teams to understand what is slow or broken and what needs to be done to improve performance. With an observability solution in place, teams can receive alerts about issues and proactively resolve them before they impact users.
Observability allows teams to:
- Monitor modern systems more effectively
- Find and connect effects in a complex chain and trace them back to their cause
- Enable visibility for system administrators, IT operations analysts and developers into the entire architecture
Pillars of Observability
Logs, metrics, and traces are often known as the “three pillars of observability”. While plainly having access to logs, metrics, and traces doesn’t necessarily make systems more observable, these are powerful tools that, if understood well, can unlock the ability to build better systems.
Logs
An event log is an immutable, timestamped record of discrete events that happened over time. Event logs in general come in three forms, but are fundamentally the same: a timestamp and a payload of some context.
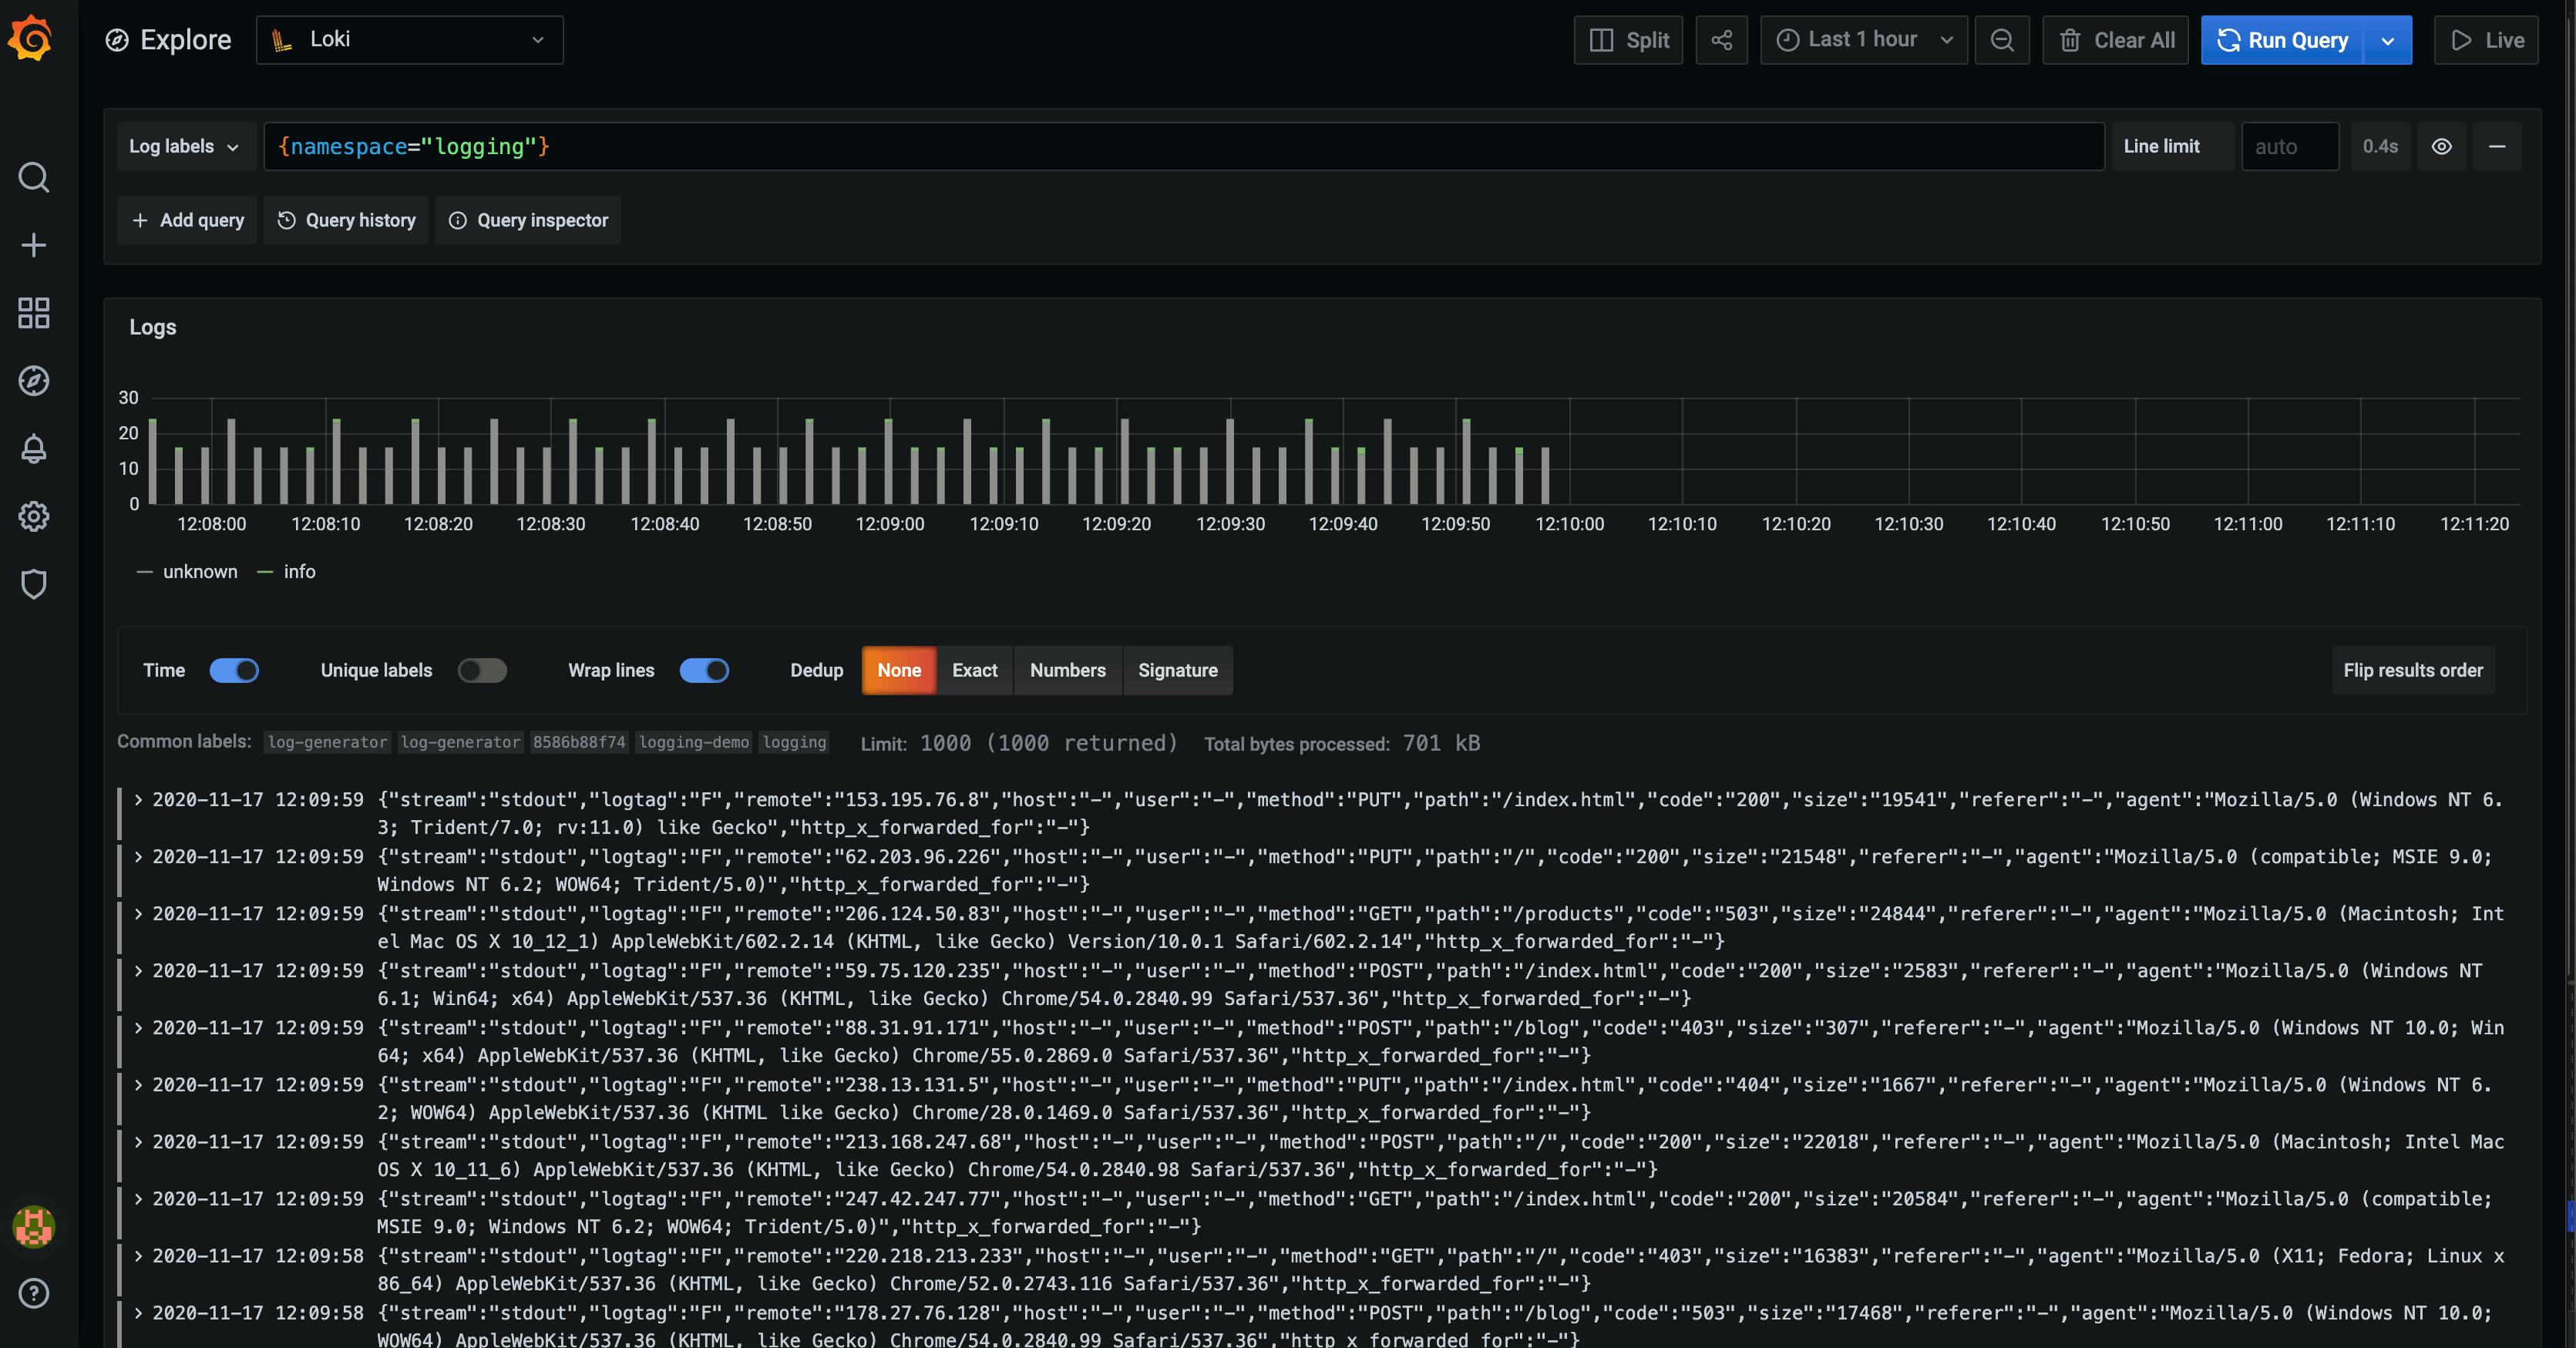
The three common forms of logs are:
Plaintext - A log record might be free-form text. This is also the most common format of logs.
Structured - Much evangelized and advocated for in recent days. Typically, these logs are emitted in the JSON format.
Binary - Think logs in the Protobuf format, MySQL binlogs used for replication and point-in-time recovery, or other such proprietary log formats used for very specific use cases.
Logging is one of the most important parts of software systems. Whether you have just started working on a new piece of software, or your system is running in a large scale production environment, you’ll always find yourself seeking help from log files.
I've discussed more about logging in this article.
Metrics
Metrics are a numeric representation of data measured over intervals of time. These are often used to count or measure a value and are aggregated over a period of time. Metrics give us insights into the historical and current state of a system.

Since they are just numbers, they can also be used to perform statistical analysis and predictions about the system’s future behavior. Unlike logs, metrics are structured by default, which makes it easier to query and optimize for storage, giving you the ability to retain them for longer periods.
Monitoring is the process of collecting, aggregating, and analyzing metrics. There are a few specific metrics, known as Golden signals, that are very effective in monitoring the overall state of the system and identifying problems. The different golden signals used for monitoring are:
- Availability: State of your system measured from the perspective of clients (e.g., percentage of errors on total requests). Availability is usually defined in the form of “some number of 9s”, for e.g., Amazon S3 is designed for four 9s of availability, i.e., 99.99% availability.
- Request Rate: Rate of incoming requests to the system. This determines the incoming traffic to the system and helps to understand the baseline scale that the system can handle.
- Error Rate: Rate of errors being produced in the system. This can be used to set up alerts to notify people if things start failing.
- Latency: Response time of the system, often measured in the 95th or 99th percentile.
- Saturation: How free or loaded the system is (e.g., queue depth or available memory).
- Utilization: How busy the system is (e.g., CPU load or memory usage).
Alerting is the reactive element of a monitoring system that triggers actions whenever metric values change. The most common and basic type of alert includes a threshold and an action the system needs to perform whenever alert rule conditions are met. When the metric configured in an alert breaches the configured threshold, the configured action is executed (e.g., send a notification (action) when the number of errors in past 1 minute (metric) is more than 10 (threshold).
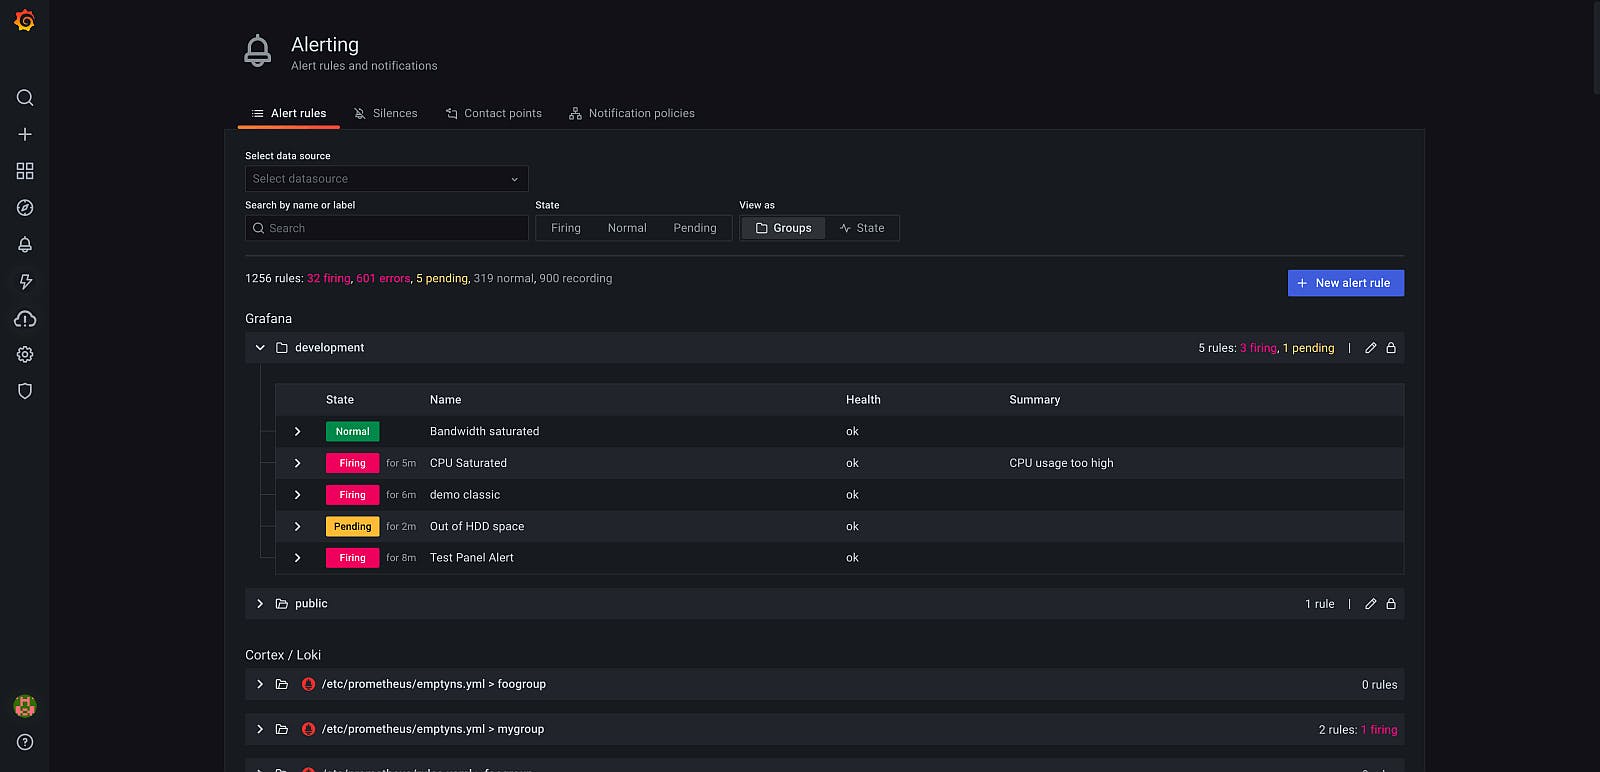
Alerts can have different levels of severity, and based on their configuration, each level can take a different actions. For, e.g., you can set an LOW severity alert on cpu_usage > 50% to send you an e-mail, but configure a HIGH severity alert to send a PagerDuty alert on cpu_usage > 80%.
I've discussed more about monitoring in this article.
Traces
A trace is a representation of a series of causally related distributed events that encode the end-to-end request flow through a distributed system. It is the documented record of a series of causally related events that happen on a network.
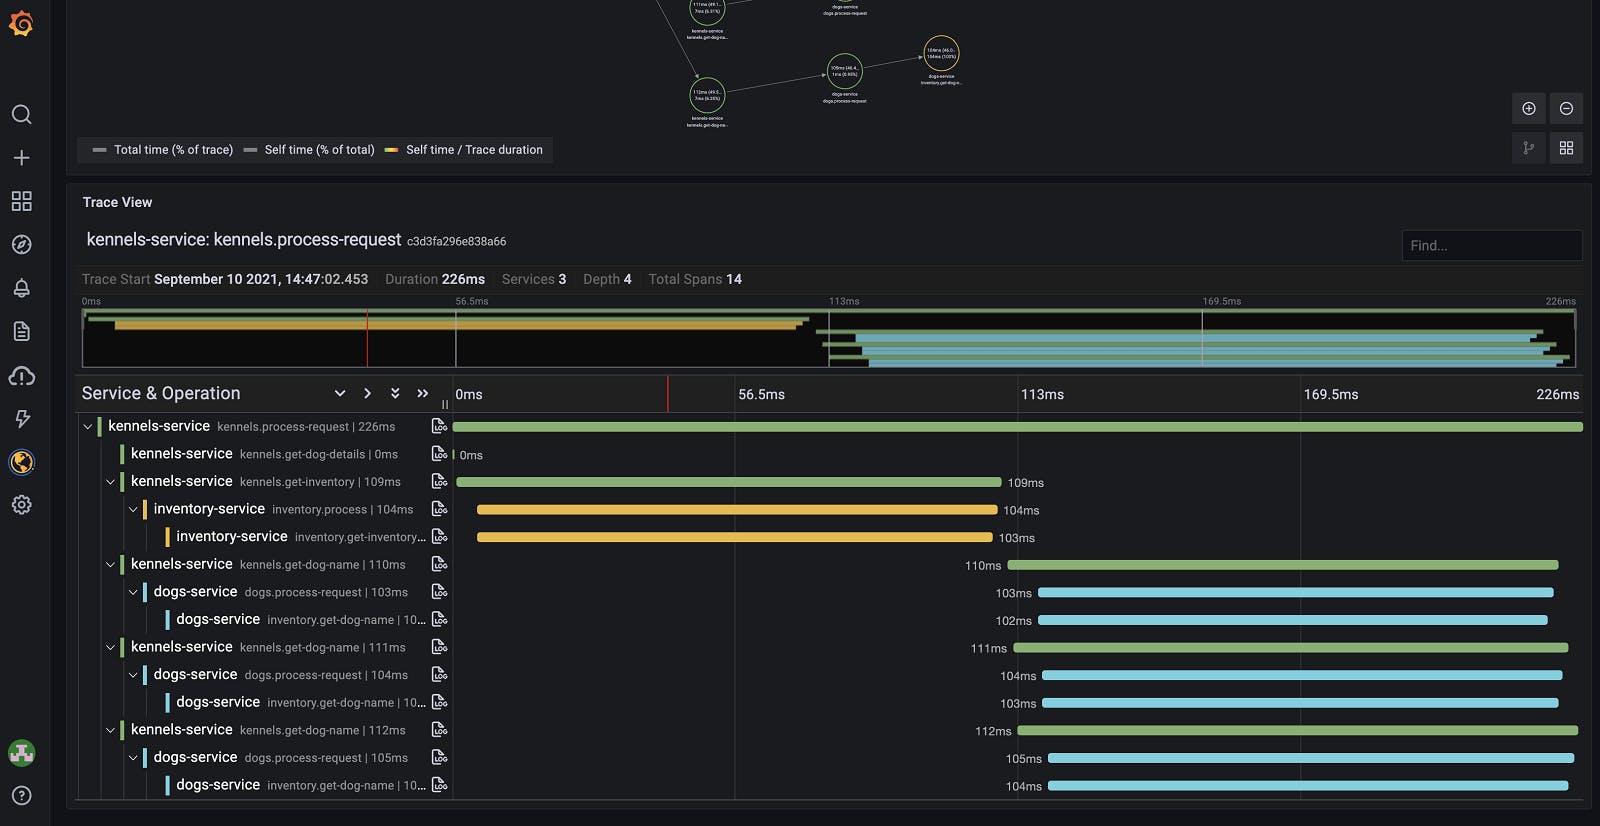
As a request moves through the host system, every operation performed on it — called a “span” — is encoded with important data relating to the microservice performing that operation. By viewing traces, each of which includes one or more spans, you can track its course through a distributed system and identify the cause of a bottleneck or breakdown.
Tracing has the following benefits that really make it worth integrating in your systems:
- Infrastructure Overview: A graphical view of the interactions between services and their dependencies
- Performance Overview: Efficient and fast detection of latency issues across the entire service ecosystem
- Intelligent Error Reporting: Use the error messages and stack traces transported by the spans to identify root cause factors or cascading failures
Implementing Observability
To achieve observability, your systems, and apps must be enabled or configured to capture the necessary telemetry data. You can use your own tools, open source software, or an enterprise observability solution, to create an observable system. Implementing observability often involves the following four elements:
Instrumentation
These are tools that collect telemetry data from a container, service, application, host and any other component of your system, enabling visibility across your entire infrastructure. For, e.g., in a Spring Boot based Java application, you could use log4j for logs, Micrometer to emit metrics, and Jaeger to generate traces.
Data correlation
The telemetry data collected from across your system is processed and correlated, which creates context and enables automated or custom data curation for time series visualizations. This is required so that all data is present at one place and related data from different sources can be accessed and analyzed with ease.
Incident response
Incident management and automation technologies are intended to get data about outages to the right people and teams based on on-call schedules and technical skills. A typical incident management process involves setting the right alerts and configuring an incident response tool (e.g., PagerDuty) to notify the on-call about any issues.
AIOps
Machine learning models are used to automatically aggregate, correlate and prioritize incident data, allowing you to filter out alert noise, detect issues that can impact the system and accelerate incident response when they do.
Tools
There are various free, paid, and open-source observability solutions in the market such as Splunk, Datadog, AppDynamics, New Relic, Elastic, Dynatrace, Wavefront, etc.
Best Practices
Use appropriate log levels to ensure that only the most important information is logged. Excessive logging can lead to higher infrastructure costs due to increased log storage costs and can sometimes have negative impact on system performance as well.
Log contextual data along with messages so that any log message contains the complete information about the event that caused it. For, e.g.,
Exception in processing Order #182726 for Product #21 due to exception - Product Not Availableis always more helpful thanSomething went wrong.Always maintain the exception stack trace in the log. This will ensure that when the log is printed, the entire stack trace is available. This can be really helpful in debugging issues related to third-party libraries used in the code.
Co-relate events across systems so that its easy to search and analyse data. An effective way of correlating events is to use a
RequestIdto identify events. This can be a simple UUID that is generated at one layer (the UI or Gateway) and propagated across all systems.Maintain consistent naming across components to ensure there is no confusion while correlating data from mutliple systems. For e.g., don't use
makePaymentin logs anddoPaymentin metrics. Use the same naming convention across all different telemetry sources.Monitor both the individual components (e.g. APIs, cache, database, etc.), and the overall system (e.g. health, availability, etc.)
Monitor the performance of any third-party services that your application interacts with. This will allow you to get notified if any third-party dependency (such as notification service or CDN) is facing an issue.
Benefits of Observability
Observability allows developers to understand an application’s internal state at any given time and have access to more accurate information about system faults in distributed production environments. A few key benefits include:
Better visibility: Sprawling distributed systems often make it hard for developers to know what services are in production, whether application performance is strong, who owns a certain service or what the system looked like before the most recent deployment. Observability gives them real-time visibility into production systems that can help remove these impediments.
Better alerting: Observability helps developers discover and fix problems faster, providing deeper visibility that allows them to quickly determine what has changed in the system, debug or fix the issues and determine what, if any, problems those changes have caused.
Better workflow: Observability allows developers to see a request’s end-to-end journey, along with relevant contextualized data about a particular issue, which in turn streamlines the investigation and debugging process for an application, optimizing its performance.
Less time in meetings: Historically, developers would have to track down information through third-party companies and apps to find out who was responsible for a particular service or what the system looked like days or weeks before the most-recent deployment. With effective observability, this information is readily available.
Accelerated developer velocity: Observability makes monitoring and troubleshooting more efficient, removing the main friction point for developers. The result is increased speed of delivery and more time for DevOps staff to come up with innovative ideas to meet the needs of the business and its customers.
Conclusion
Observability is an important and useful approach to understanding the state of your entire infrastructure. Logs, metrics, and traces serve their own unique purpose and are complementary. In unison, they provide maximum visibility into the behavior of distributed systems. The cloud, containerization, microservices and other technologies have made systems more complex than they’ve ever been. Observability must become part of the culture of engineers and managers as the adoption of microservices and containers increases.
This article is based on my recent talk at the Orkes x MongoDB meetup in Hyderabad, India.
Thank you for staying with me so far. Hope you liked the article. You can connect with me on LinkedIn, where I regularly discuss technology and life. Also take a look at some of my other articles and my YouTube channel. Happy reading. 🙂

